Insight
Fueling Financial Performance: A Step-by-Step KPI Guide
By Erika Running, Senior Director, Revenue Cycle Management
What does “productivity” mean to you?
If you work in healthcare finance or the revenue cycle, there’s a good chance your answer involves volume: number of claims worked, tasks completed, or accounts touched. But what if those metrics—so easy to count and report—are missing the bigger picture?
Too often, traditional productivity measures fail to reflect the true performance of your revenue cycle. For revenue cycle teams, especially those navigating today’s complex payer environment with lean resources, the key lies in tracking the right metrics and turning them into meaningful action. This blog explores how outcome-focused KPIs and thoughtful data use—particularly within MEDITECH Expanse—can help organizations improve cash flow, reduce risk, and drive sustainable financial performance.
Why Traditional Metrics Fall Short
Productivity reports built around volume can be misleading. They may tell you how busy your team is, but not whether their work is driving real results. In fact, traditional productivity metrics can create a false sense of efficiency while masking underlying issues like claim denials, delayed reimbursements, and mounting A/R backlogs.
Common pitfalls include:
- Emphasis on volume over outcomes
- Metrics that don’t align with financial goals
- Manual, burdensome tracking for small or rural teams
These outdated approaches leave teams overwhelmed and leadership in the dark.
It’s Time To Measure What Matters
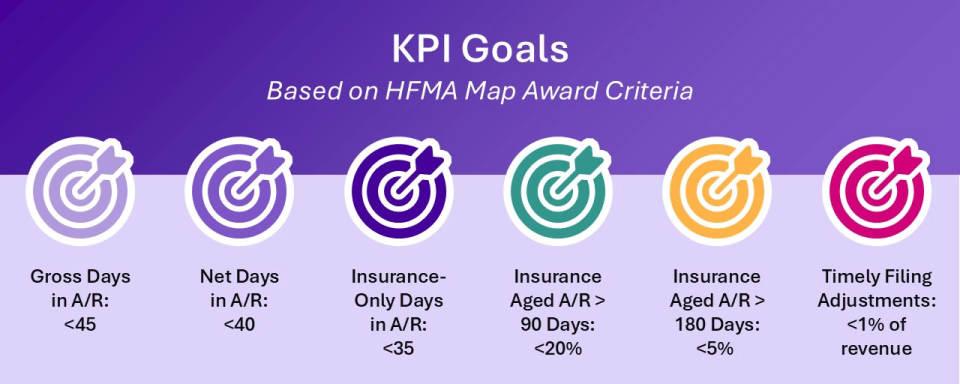
To improve performance and financial sustainability, healthcare organizations need to rethink which KPIs they track—and why. The Healthcare Financial Management Association (HFMA) MAP Initiative offers a clear standard: Focus on outcome-based KPIs that reflect actual financial performance.
KPIs That Matter
| 1 | Clean Claim Rate |
| 2 | Days in A/R (gross, net, insurance-only) |
| 3 | Insurance Aged A/R >90 Days and >180 Days |
| 4 | Timely Filing Adjustments |
| 5 | Average Monthly Cash |
These metrics provide actionable insight. They highlight opportunities for process improvement, payer follow-up, and system optimization—ultimately helping teams prioritize work that drives results.
KPI Goals
Making the Numbers Work for You
Many organizations already have the data they need to calculate performance-based KPIs—they just need a better way to access and use it. For teams working in MEDITECH Expanse, daily views of receivables, unbilled amounts, and payments can offer a reliable source of truth.
For example:
- Days in A/R = Total A/R ÷ Average Daily Revenue
- Insurance A/R = Total A/R – Self-Pay A/R
- A/R Aging % = Total Aged A/R >90 (or >180) ÷ Total A/R × 100
- Monthly Cash = Total payments for the current month (month-to-date)
When teams are trained to extract and interpret this data, they gain a much clearer picture of their progress—and a stronger foundation for decision-making.
Mastering Key Metrics in MEDITECH Expanse
Even with strong EHR tools in place, many organizations struggle to turn raw financial data into insights that drive action. To unlock the full value of MEDITECH Expanse, revenue cycle leaders need to start by pinpointing key performance data and understanding how to use it to inform smarter, faster decisions.
The table below provides strategic guidance on where and how to source essential KPI data within MEDITECH Expanse, enabling teams to drive performance conversations rooted in accurate, actionable data.
| KPI | How To Find in MEDITECH Expanse |
| Average Daily Revenue | Select 'Receivables' in the Daily View and use the 'Average Daily Revenue' total displayed. |
| Total A/R | Select 'Receivables' in the Daily View. The current date's total is your Total A/R. |
| Total Insurance A/R | Select 'Receivables' > 'Insurance'. Subtract Self-Pay A/R from Total A/R for the current date. |
| Total UR | Select 'Receivables' > 'Unbilled'. The total shown is your Total UR. |
| Total Gross A/R Days | Calculate: Total A/R + Total UR |
| Total Gross A/R Days with UR | Calculate: (Total Gross A/R) / Average Daily Revenue. |
| Insurance Only A/R | Calculate: Total A/R With Self-Pay - Self-Pay A/R |
| Insurance Only Days in A/R | Calculate: (Insurance Only A/R) / Average Daily Revenue. |
Accessing the right data is just the beginning. The next step is translating that information into actionable insight—identifying trends, spotting bottlenecks, and prioritizing interventions that have real financial impact. By consistently reviewing these KPIs and aligning them with organizational goals, revenue cycle teams can move from reactive reporting to proactive performance management.
Client Spotlight: Pender Community Hospital
At Pender Community Hospital, a rural critical access hospital, outdated systems and manual processes were impacting performance. Leaders wanted to tackle high denial rates and growing A/R backlogs with greater visibility into key metrics.
By adopting a data-driven approach and tracking HFMA-aligned KPIs, the hospital was able to establish realistic performance targets and drive improvement.
Tegria's expertise was instrumental in transforming our revenue cycle management. Their collaborative approach and deep understanding of MEDITECH's capabilities enabled us to streamline workflows and enhance financial performance.
LAURA GAMBLECEO, Pender Community Hospital
Key outcomes included:
| KPIs | One Year Ago | Current |
|---|---|---|
| Gross Days in A/R | 66 | 40 |
| Insurance Only Days in A/R | 55 | 28 |
| A/R > 90% | 44% | 11% |
| A/R > 180% | 11% | 3% |
| Denial Rate | 21% | 6% |
This transformation didn’t happen overnight—but it started with a simple step: rethinking what productivity really means.
The Bottom Line
Are you measuring the right things? Or just what’s easy to see and report?
Filling a report with data won’t help you address revenue cycle problems. Identifying metrics that truly matter, and aligning goals with your organizational strategy and operations, will accelerate revenue cycle performance and get you where you want to go, faster.
Let’s transform productivity together.
We work with healthcare organizations to go beyond basic KPI tracking, from designing performance dashboards to aligning metrics with business objectives and training teams to act on insights. Whether you need KPI realignment or a fresh reporting strategy, we're here to help.